Research and online Microstructure Breakout Alpha
End-to-end walkthrough: detecting microstructure breakouts with multi-factor, multi-clock confirmation — from project setup through batch research to live streaming deployment.
1. Scenario
Assume you need to detect microstructure breakouts in BTCUSDT order flow — distinguishing institutionally-driven price level breakthroughs from noise. The strategy requires simultaneous confirmation across four signals (price velocity, volume surge, flow direction, and depth vacuum), each measured on its most informative bar clock.
With QuantFlow, you can quickly provision a project and define the feature set by picking features from the existing feature library. If a feature you need does not exist, add it as a custom FeatureType — all features are then generated and ready. From there, iterate: add or drop features, change parameters, swap normalizations, adjust label horizons — re-run in batch mode against historical data for immediate feedback. Review feature importance, backtest, refine, repeat. Once you have a validated model, switch the mode from batch to streaming. Same YAML definitions, no code changes. Research feeds production, not a rewrite.
2. Project Setup
Install QuantFlow and scaffold a project from the crypto template:
pip install quantflow

qf init breakout_alpha --template crypto

cd breakout_alpha
Once inside the project directory, open .local_config.yml and quantflow_project.yml to configure credentials, data engines, symbols, bar types, labels, and features.
.local_config.yml
Credentials and engine connections:
feed_provider_credentials:
  - provider: cryptohftdata
    key: "your-api-key-here"

engine:
  - name: duckdb
    database: ".data/db/quantflow.duckdb"

  - name: dolphindb
    host: "localhost"
    port: 8848
    database: "quantflow_db"
    auth: password
    key:
      username: "admin"
      password: "123456"

  - name: kafka
    host: "localhost:9092"

local_cache:
  path: ".data/.local"
quantflow_project.yml
The template ships with sources, feed providers, and engine backends pre-configured — you can leave those as-is. The three sections you will actively work on are bars, labels, and features.
Bars
Open quantflow_project.yml. Define the bar types the State Engine will produce. Each bar type serves a different role in the feature set:
  state_engine:
    force_refresh: false
    micro_batch_size: 200000
    bars:
      - type: dollar
        threshold: 50000
      - type: imbalance
        k: 10
      - type: tick
        count: 50
      - type: run
        window: 10
    snapshots:
      period_seconds: 0.5
      depth_levels: 20
- dollar ($50k threshold) — the default clock: volume-standardized, robust to varying trade intensity
- imbalance (k=10) — for order flow features: samples when information asymmetry arrives
- tick (50 trades) — the fastest clock: for execution features that need fresh data
- run (10-tick window) — for liquidity vacuum detection: captures sequential same-direction trades
Labels
Two triple-barrier label definitions at different horizons — capturing both short-term and medium-term breakout outcomes:
  label_engine:
    historical_label_engine: polars
    labels:
      - name: triple_barrier_20_10bp
        type: triple_barrier
        parameters:
          horizon: 20
          upper_barrier: 0.001
          lower_barrier: 0.001
          vertical_barrier: 20
        inputs:
          close: close
          high: high
          low: low
        dependencies:
          - cdm_dollar_bars
        bar_types: [dollar]

      - name: triple_barrier_50_5bp
        type: triple_barrier
        parameters:
          horizon: 50
          upper_barrier: 0.0005
          lower_barrier: 0.0005
          vertical_barrier: 50
        inputs:
          close: close
          high: high
          low: low
        dependencies:
          - cdm_dollar_bars
        bar_types: [dollar]
Features
Activate the microstructure_breakout feature set with dollar_k_50000 as the default bar (features that require a specific bar type will override it in the feature configuration). The feature set definition itself is created separately (next section):
feature_engine:
  ...

  features:
    - name: microstructure_breakout
      type: microstructure_breakout
      bar: dollar_k_50000
3. The Microstructure Breakout Feature Set
Now you will create the core of the strategy: the microstructure_breakout feature set. It bundles 15 features across all five dimensions, each on its most informative bar clock.
In your editor, create .definitions/features/microstructure_breakout.yml and start with the top-level configuration:
Top-Level Configuration
name: microstructure_breakout
description: >
  Two-directional microstructure breakout detection. Each feature on its
  native bar clock — OFI+cumulative delta on imbalance bars, liquidity
  vacuum on run bars, spread/slippage on tick bars, all others on dollar bars.
pattern: breakout
horizon_type: intraday
mode: tick_to_bar
normalization:
  warmup_bars: 100
tick_to_bar mode means features are computed at tick resolution — capturing every microstructure event as it happens — but values are only emitted when a new bar forms on the assigned bar clock.
Signal Features
Seven directional prediction features form the breakout confirmation system:
signal_features:
  - name: breakout_strength
    type: price_velocity_volume_ratio
    params: { window: 50 }
    inputs: [cdm_trade_enriched]
    normalization:
      method: rolling_zscore
      window: 100
      clip: [-5, 5]
    output_type: scalar
    bar_aggregation: max

  - name: breakout_volume_spike
    type: relative_volume
    params: { window: 100 }
    inputs: [cdm_trade_enriched]
    normalization:
      method: rolling_zscore
      window: 100
      clip: [0, 20]
    output_type: scalar
    bar_aggregation: max

  - name: volatility_expansion
    type: realized_volatility
    params: { window: 20 }
    inputs: [cdm_trade_enriched]
    normalization:
      method: minmax
      clip: [0, 1]
    output_type: scalar
    bar_aggregation: last

  - name: volatility_compression_score
    type: realized_volatility_percentile
    params: { short_window: 20, long_window: 300 }
    inputs: [cdm_trade_enriched]
    normalization:
      method: minmax
      clip: [0, 1]
    output_type: scalar
    bar_aggregation: last

  - name: order_flow_imbalance
    type: ofi
    params: { decay: 0.95, levels: 5 }
    inputs: [cdm_trade_enriched]
    normalization:
      method: rolling_zscore
      window: 50
      clip: [-5, 5]
    output_type: scalar
    bar_aggregation: mean
    bar: imbalance_k_10
    staleness:
      ttl_ms: 5000
      action: decay

  - name: cumulative_delta
    type: cumulative_volume_delta
    params: { window: 200 }
    inputs: [cdm_trade_enriched]
    normalization:
      method: rolling_zscore
      window: 100
      clip: [-5, 5]
    output_type: scalar
    bar_aggregation: mean
    bar: imbalance_k_10
    staleness:
      ttl_ms: 5000
      action: decay

  - name: liquidity_vacuum_score
    type: depth_change_rate
    params: { window: 50, side_sensitive: true, levels: 5 }
    inputs: [cdm_trade_enriched]
    normalization:
      method: minmax
      clip: [-1, 1]
    output_type: scalar
    bar_aggregation: mean
    bar: run_w_10
    staleness:
      ttl_ms: 3000
      action: invalidate
| Feature | Type | Clock | Why it's included |
|---|---|---|---|
breakout_strength | price_velocity_volume_ratio | dollar (default) | Detects conviction-weighted price thrust — genuine breakouts move fast on real volume, not noise |
breakout_volume_spike | relative_volume | dollar (default) | Independent volume confirmation — institutional flow leaves a volume footprint; asymmetric clip [0,20] ignores low-volume noise |
volatility_expansion | realized_volatility (w=20) | dollar (default) | Breakouts are volatility events — short-window expansion confirms the regime shift is underway |
volatility_compression_score | realized_volatility_percentile | dollar (default) | Pre-breakout compression — low values (short vol far below long vol) signal a coiled, spring-loaded market |
order_flow_imbalance | ofi (decay=0.95) | imbalance_k_10 | Aggressive pressure at top of book — imbalance bars sample when information arrives; 5s decay prevents stale signals |
cumulative_delta | cumulative_volume_delta | imbalance_k_10 | Net committed volume over 200 bars — confirms OFI with actual executed trades, not just quote changes |
liquidity_vacuum_score | depth_change_rate | run_w_10 | Book thinning during breakout — sequential same-direction liquidity consumption; 3s TTL with invalidate (discard stale) |
Quality Features
Two features assess whether the breakout signals are reliable enough to trade:
quality_features:
  - name: breakout_snr
    type: signal_to_noise_ratio
    params: { window: 50 }
    inputs: [breakout_strength]
    normalization: { method: none, clip: [0, 20] }
    output_type: scalar
    bar_aggregation: last

  - name: breakout_sharpe
    type: rolling_sharpe_ratio
    params: { window: 100 }
    inputs: [breakout_strength]
    normalization: { method: none }
    output_type: scalar
    bar_aggregation: last
breakout_snrmeasures how clean the breakout_strength signal is relative to its noise floor. When SNR is high (above 3), the breakout signal stands clearly above market noise — actionable. When SNR is low, the signal is buried and you should defer.breakout_sharpetracks the rolling risk-adjusted return of the breakout signal. A positive, stable Sharpe over 100 bars indicates the breakout signal has predictive consistency; a declining or negative Sharpe suggests the signal is degrading and parameters may need tuning.
Both take breakout_strength as input — a cross-feature dependency within the pack. Quality features run on the default dollar bar clock.
Regime, Stability, and Execution Features
regime_features:
  - name: volatility_regime
    type: realized_volatility
    params: { window: 300 }
    inputs: [cdm_trade_enriched]
    normalization: { method: minmax, clip: [0, 1] }
    output_type: scalar
    bar_aggregation: last

  - name: liquidity_regime
    type: spread_regime_indicator
    params: { window: 100 }
    inputs: [cdm_trade_enriched]
    normalization: { method: minmax, clip: [0, 1] }
    output_type: scalar
    bar_aggregation: last

  - name: momentum_10t
    type: rate_of_change
    params: { window: 10 }
    inputs: [cdm_trade_enriched]
    normalization: { method: rolling_zscore, window: 50, clip: [-5, 5] }
    output_type: scalar
    bar_aggregation: mean

stability_features:
  - name: momentum_autocorr
    type: autocorrelation
    params: { lag: 10 }
    inputs: [momentum_10t]
    normalization: { method: none, clip: [-1, 1] }
    output_type: scalar
    bar_aggregation: last

execution_features:
  - name: spread_bps
    type: spread_bps
    inputs: [cdm_trade_enriched]
    normalization: { method: none, clip: [0, 500] }
    output_type: scalar
    bar_aggregation: last
    bar: tick_k_50
    staleness: { ttl_ms: 500, action: invalidate }

  - name: slippage_proxy
    type: cumulative_depth
    params: { levels: 5, weighted: true }
    inputs: [cdm_trade_enriched]
    normalization: { method: none }
    output_type: scalar
    bar_aggregation: last
    bar: tick_k_50
    staleness: { ttl_ms: 500, action: invalidate }
- Quality features assess signal reliability:
breakout_snrmeasures the signal-to-noise ratio of breakout_strength — high SNR means the signal stands clearly above market noise;breakout_sharpetracks rolling risk-adjusted return quality over 100 bars. - Regime features provide context:
volatility_regime(300-bar, long context) gates whether breakouts are tradeable;liquidity_regimemonitors spread conditions;momentum_10tcaptures pre-breakout trend direction. - Stability:
momentum_autocorrchecks post-breakout trend persistence — positive autocorrelation confirms the breakout is sticking; negative signals choppy mean-reversion. - Execution features run on
tick_k_50— the fastest clock. Spread and depth readings older than 500ms are invalidated (not decayed) because stale execution data is worse than no data for trade timing.
Multi-Clock Architecture
The pack uses four bar clocks, each chosen for its information-theoretic properties:
| Clock | Features | Rationale |
|---|---|---|
dollar_k_50000 (default) | breakout_strength, breakout_volume_spike, volatility_expansion, volatility_compression_score, breakout_snr, breakout_sharpe, volatility_regime, liquidity_regime, momentum_10t, momentum_autocorr | Volume-standardized baseline — robust to varying trade intensity |
imbalance_k_10 | order_flow_imbalance, cumulative_delta | Bars that sample when new information arrives via order flow asymmetry — best resolution for flow-based signals |
run_w_10 | liquidity_vacuum_score | Bars triggered by sequential same-direction trades — captures the micro-dynamics of liquidity consumption |
tick_k_50 | spread_bps, slippage_proxy | Fastest clock — execution conditions change on every trade; 500ms staleness TTL prevents stale quote data |
Staleness contracts bridge the clocks. When the decision clock (dollar bar) fires:
- OFI and cumulative_delta from imbalance bars: decay toward zero after 5 seconds without a new bar (signal fades, doesn't freeze)
- Liquidity vacuum from run bars: invalidate after 3 seconds (discard entirely — no stale depth readings)
- Spread and slippage from tick bars: invalidate after 500ms (execution data must be fresh)
Pack Parameters
parameters:
  bar:
    type: string
    description: Default bar clock for features without explicit bar override
    default: dollar_k_50000
4. Creating a Custom FeatureType: cumulative_volume_delta
One of the signal features — cumulative_volume_delta — is a custom FeatureType you need to create. In your editor, create .definitions/feature_types/signal/cumulative_volume_delta.yml:
name: cumulative_volume_delta
description: >
  Cumulative volume delta: rolling sum of signed volume (buy - sell).
  Positive = net buying pressure, Negative = net selling pressure.
category: order_flow
version: v1.0
dimension: signal
status: active

required_inputs:
  - cdm_trade_enriched.buy_volume
  - cdm_trade_enriched.sell_volume

output_column: cumulative_delta
output_description: Rolling sum of net volume (buy_volume - sell_volume)

parameters:
  window:
    type: integer
    description: Rolling window size (bars)
    required: false
    default: 200
    constraints:
      min: 10
      max: 10000

formula: "rolling_sum((buy_volume - sell_volume), window)"
Each field explained:
required_inputs: Fully qualified column references —cdm_trade_enriched.buy_volumeandcdm_trade_enriched.sell_volume. The FeatureDAG compiler resolves these to the CDM tables produced by the State Engine.parameters.window: A single configurable integer with constraints. In the feature set, we override the default 200 by settingparams: { window: 200 }— though in our case we use the default.formula:rolling_sum((buy_volume - sell_volume), window)— computes net signed volume over the last N bars. FeatureDAG's AST compiler turns this into an IR DAG, then lowers it to Polars (batch) or DolphinDB (streaming). The same formula runs on both backends.output_column:cumulative_delta— this is the column name you reference when consuming feature output.
All FeatureTypes follow this same schema. The formula string supports 40+ built-in functions — see the Formula Language Reference for the complete catalog.
5. Running the Batch Pipeline
Via Dagster
Dagster provides asset lineage, run history, and per-stage retries. Start the UI from your project directory:
dagster dev -w dagster_workspace.yaml
The dagster_workspace.yaml contains a single auto-discovery directive:
load_from:
  - python_module: quantflow.pipeline.dagster.auto
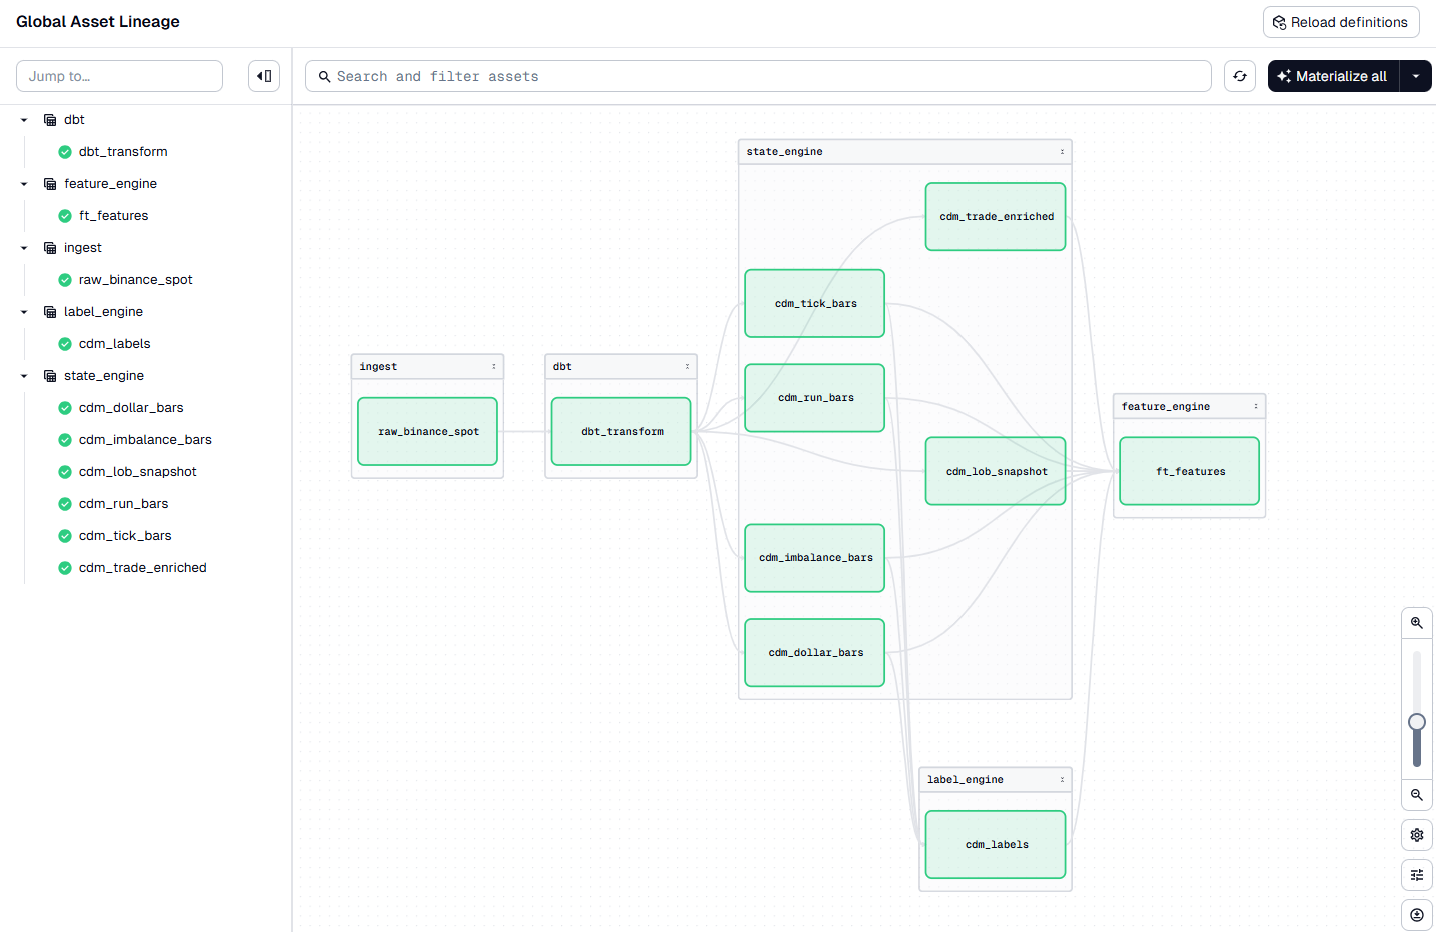
In the Dagit UI at http://localhost:3000, you'll see the 5-stage asset graph:
ingest → dbt → state_engine → label_engine → feature_engine
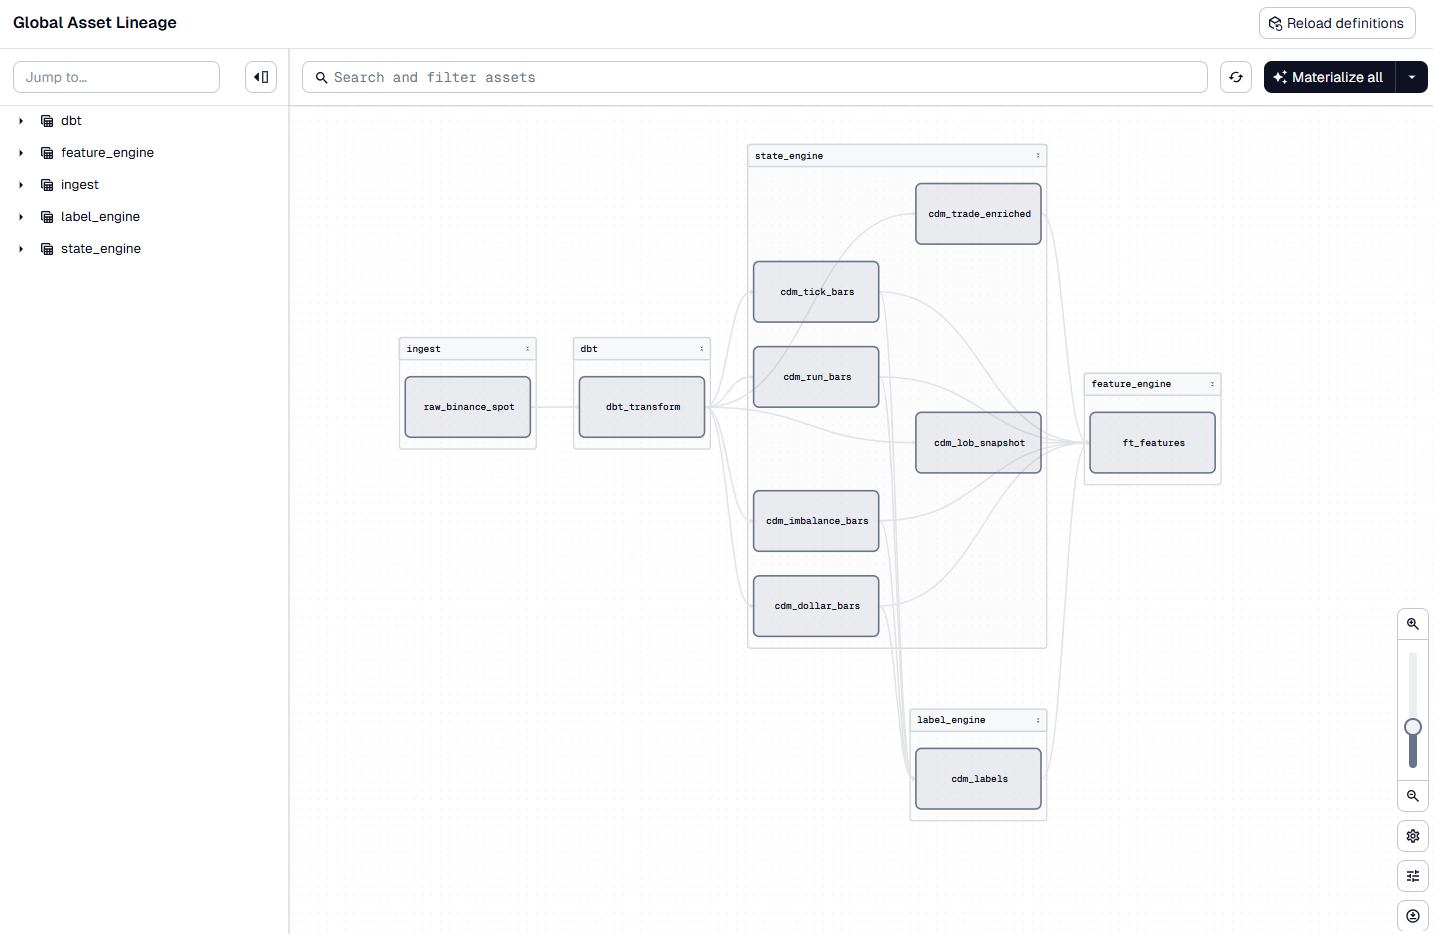
In the Dagit UI, specify the date range and click Materialize All. Each stage runs in sequence:
- Ingest — downloads raw trades and LOB data from the historical feed provider (
cryptohftdata), caches Parquet files locally - dbt — runs dbt models: staging models map raw columns to the CDM schema (type casts, field mappings, venue prefixes), then CDM models union across providers into unified
cdm_tradesandcdm_lob_incrementaltables - State Engine — the Numba fused kernel processes events in micro-batches, producing per-type bar tables (
cdm_dollar_bars,cdm_imbalance_bars,cdm_tick_bars,cdm_run_bars), enriched trades (cdm_trade_enriched), and LOB snapshots (cdm_lob_l2) - Label Engine — reads dollar bars, computes triple-barrier labels at both horizons, writes
cdm_labels - Feature Engine — compiles all 15 features through the IR pipeline, resolves cross-feature dependencies (e.g.,
momentum_autocorrdepends onmomentum_10t), runs the DAG on Polars, writesbreakout_alpha_feature.features
Via CLI
For quick runs without the UI:
# Full pipeline
qf run --start-date 2026-04-15 --end-date 2026-04-20

# Individual stages
qf run --engine state --start-date 2026-04-15 --end-date 2026-04-20
qf run --engine feature --start-date 2026-04-15 --end-date 2026-04-20
6. Batch Results
After a successful run, open the DuckDB database at .data/db/quantflow.duckdb. You should see the following tables:
| Schema | Table | Contents |
|---|---|---|
breakout_alpha_cdm | cdm_trade_enriched | Trades with L1 enrichment (mid, spread, micro-price, direction) |
breakout_alpha_cdm | cdm_lob_l2 | 20-level LOB snapshots every 500ms |
breakout_alpha_cdm | cdm_dollar_bars | Dollar bars at $50k threshold |
breakout_alpha_cdm | cdm_imbalance_bars | Imbalance bars at k=10 |
breakout_alpha_cdm | cdm_tick_bars | Tick bars at 50 trades |
breakout_alpha_cdm | cdm_run_bars | Run bars at 10-tick window |
breakout_alpha_cdm | cdm_labels | Triple-barrier labels (both horizons) |
breakout_alpha_feature | features | All 15 feature values, per bar clock |
The breakout_alpha_feature.features table contains all 15 feature values keyed by (symbol, bar_clock, feature_name, feature_time). Join it with cdm_labels on symbol and feature_time to produce the training set — features and labels are already time-aligned. From here you can train a model, run a backtest, or export to your ML pipeline of choice.
Now iterate. Change feature parameters in the feature YAML, adjust label horizons, add or remove bar types — re-run and compare results. Batch mode gives you fast feedback: each iteration takes minutes, not hours. Once you are satisfied with the signal quality, move to streaming.
7. Streaming to Production
The same YAML definitions deploy to streaming without modification. Only the execution backend changes.
Prerequisites
DolphinDB is running and accessible. The Community Edition is available at dolphindb.com. You configured the connection in .local_config.yml in Section 2.
The crypto template includes binance_spot_streaming — a WebSocket connection to Binance's public streams at wss://stream.binance.com:9443. It maps raw Binance trade messages (s, p, q, m fields) to the CDM schema via field mappings in .definitions/feed_providers/binance_spot_streaming.yml.
Deploy
From your project directory, switch to streaming mode:
qf run --mode streaming
You should see output confirming each stage deployed:
Project: breakout_alpha
Mode: streaming
Starting streaming pipeline...
Pipeline deployed — 3 job(s)
Run 'qf pipeline status' to check health
Three stages are now running inside DolphinDB:
- Ingest — the WebSocket client connects to
wss://stream.binance.com:9443and subscribes to two streams:trade.btcusdt(real-time trades) anddepth20@100ms(top-20 LOB levels refreshed every 100ms). Each incoming JSON message is parsed and field-mapped to the CDM schema — Binance'ssbecomessymbol,pbecomesprice(cast to double),qbecomessize, andm(buyer-is-maker flag) becomesis_buyer_maker. Avenueliteral ("binance") andprocessed_timetimestamp are added. The mapped events flow into DolphinDB stream tables, ready for the State Engine downstream - Process — the State Engine consumes the raw stream, reconstructs the order book, enriches trades with L1 context (mid-price, spread, micro-price), and emits bars on all four clocks simultaneously. Snapshots fire every 500ms at 20 depth levels
- Feature — the Feature Engine listens to each bar clock independently, computes the 15 features assigned to that clock, applies normalization (z-score, minmax), and publishes the feature vector to the Kafka sink configured in
quantflow_project.yml
Verify everything is healthy:
qf pipeline status
This shows per-stage health, queue depth, and throughput. If a stage's queue depth is growing, the downstream consumer is bottlenecked. The Python CLI handles only deployment and monitoring — it can disconnect after deployment; all computation runs inside DolphinDB.
8. Streaming Results
In addition to the unified features stream table, the cdm_trade_enriched, cdm_lob_l2, and all deployed bar tables are also available in DolphinDB for ad-hoc queries or custom monitoring.
For a real-time monitoring dashboard, see the blog post Build a Low-Latency Monitor Dashboard, which walks through connecting DolphinDB stream tables to Grafana.
9. Next Steps
- Browse the full Feature Library — 133 FeatureTypes across 6 dimensions
- Learn the Formula Language — 40+ built-in functions for defining custom FeatureTypes
- Customize further: Custom Feature Types, Custom Labels
- Explore the Python API for programmatic pipeline control
- See Running Pipelines for the complete CLI reference